Analytics & Reports
The Analytics & Reports module in Sponsy offers a comprehensive suite of tools designed to provide in-depth insights into your sponsorship activities, enabling data-driven decisions to optimize revenue and performance.
The Analytics & Reports module belongs to ourScaleplan or higher.
The Analytics & Reports module in Sponsy offers a comprehensive suite of tools designed to provide in-depth insights into your sponsorship activities, enabling data-driven decisions to optimize revenue and performance.
Reports Overview
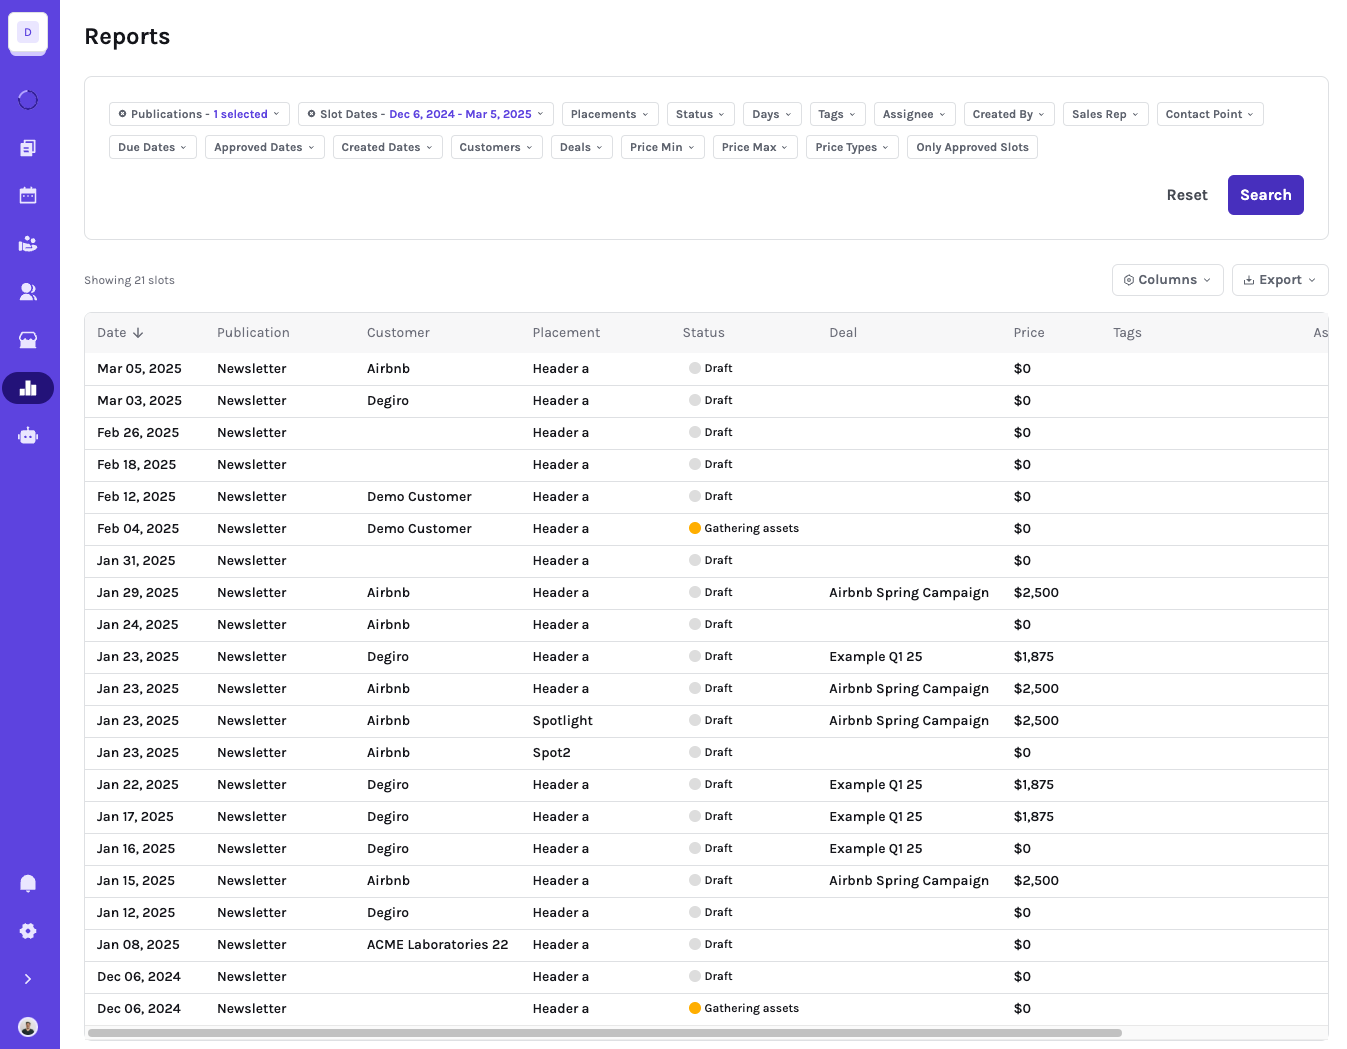
The Reports page is your workspace for building, saving, sharing, and exporting views of your sponsorship data. You can switch between Slots reports and Deals reports depending on the question you are trying to answer.
Slots and Deals reports
Use Slots reports when you want to analyze placement-level performance, content status, publication dates, customers, tags, metrics, and booked inventory.
Use Deals reports when you want to analyze pipeline, revenue, deal status, sales reps, customers, and deal line items. Deal reports can include the individual line items that make up a deal, so you can export the same campaign broken down by publication, placement, date, and price.
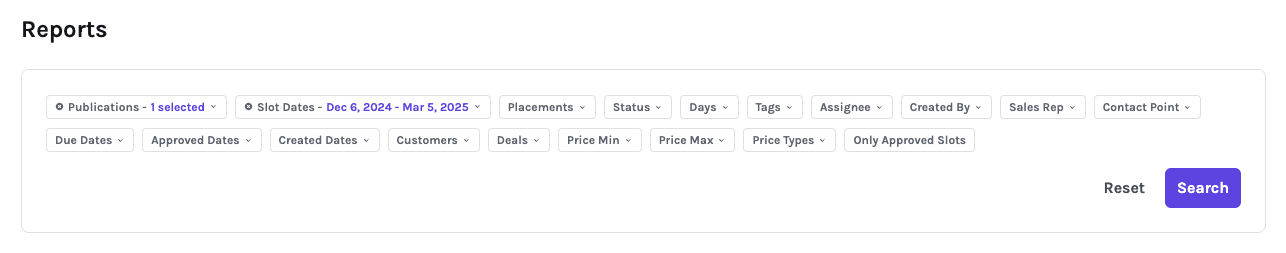
Filtering Data
At the top of the Reports page, you’ll find filters that allow you to drill down into specific data points. Reports support fixed date ranges as well as dynamic date ranges, such as "Last 30 days", so saved reports can stay current without manual updates.
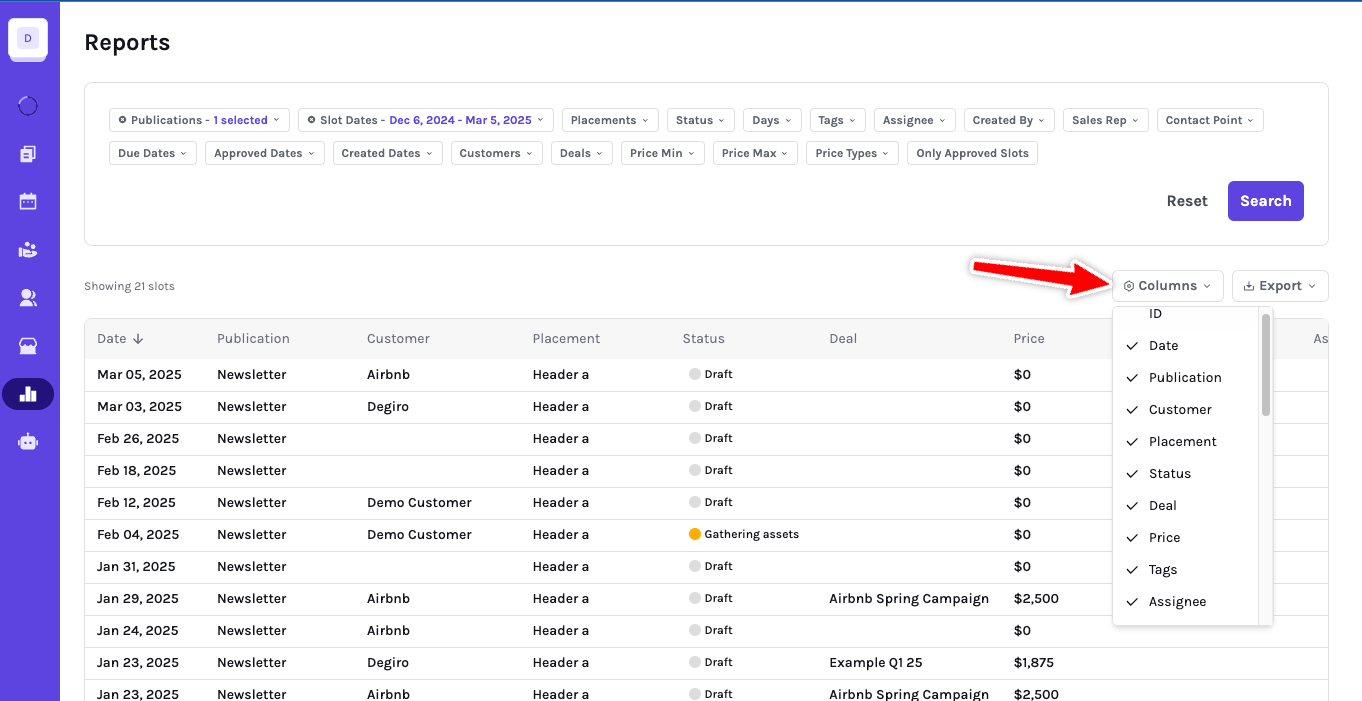
Customizing Columns
Tailor your data view by selecting or deselecting columns using the Columns option located at the top right corner of the table. Your visible columns control what you see in the report and what gets included when you export the current view.
Saved reports
After configuring filters, columns, entity type, and chart options, save the report so you can reopen it later from the Saved Reports sidebar. Saved reports can be personal or shared with teammates, depending on the sharing options you choose.
Workspace reports can also be shared by email when you need to send the same report setup to another teammate.
Charts
Turn on Plot to visualize the current report above the table. You can choose Bar, Line, Scatter, or Pie charts, then configure the X and Y axes, optional grouping, and aggregation method.
Supported aggregations include Sum, Average, and Count. Chart settings are saved with the report, so the visualization is restored when you reopen it.
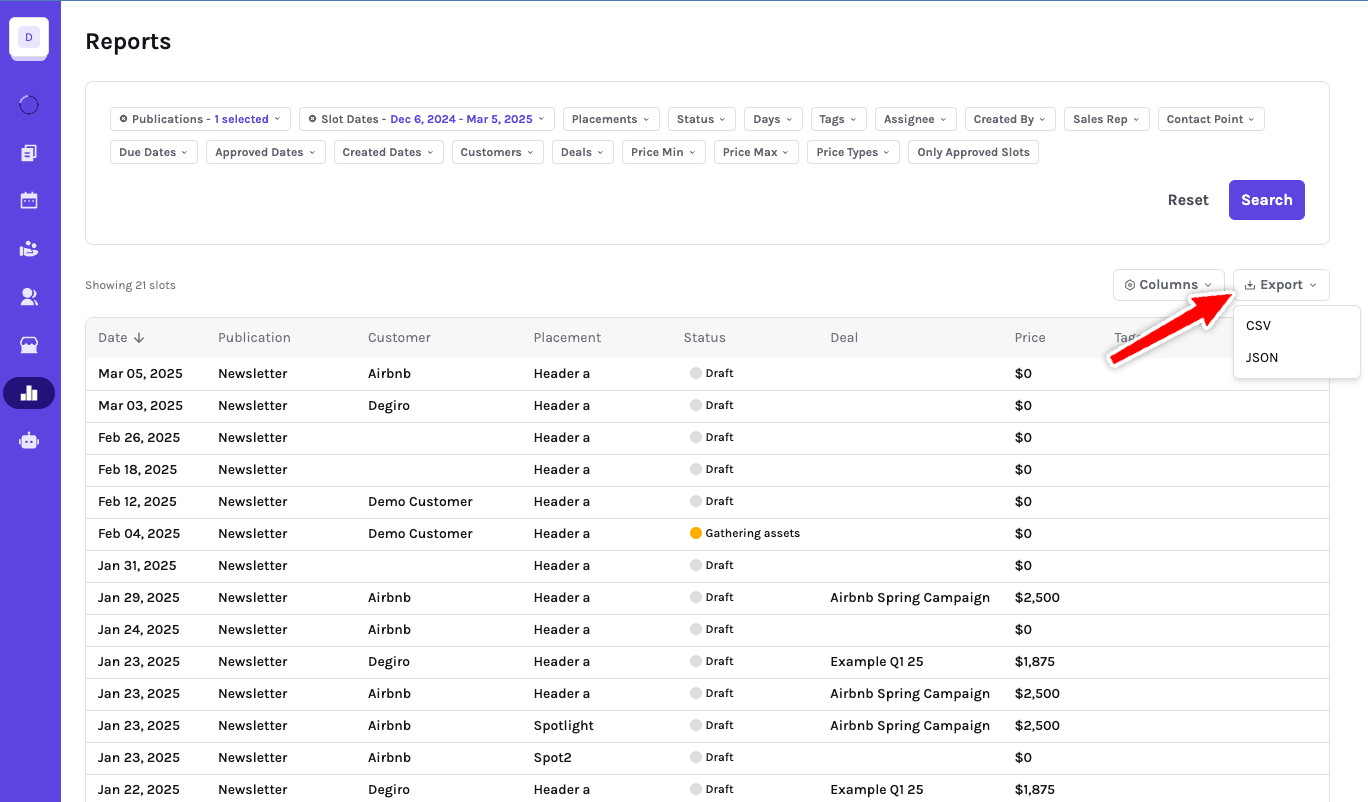
Exporting Reports
Use Export to download the current report as CSV or JSON. Exports respect your current filters and visible columns.
For deal reports, use the line-item export when you need each deal broken down into the publication, placement, date, customer, and price rows that make up the deal. This is useful for finance reviews, campaign reconciliation, and spreadsheet handoffs.
Reports can also include conversion columns when conversion data is available, helping you connect clicks to outcomes instead of only measuring activity.
Link tracking in reports
Publication-level link tracking helps keep sponsor URLs consistent by applying the right query parameters when slot content is saved. Cleaner links make exported reports easier to reconcile with campaign, publication, placement, deal, and slot data.
Publication Metrics
Sponsy provides a range of publication metrics to assess the performance of your individual publications.
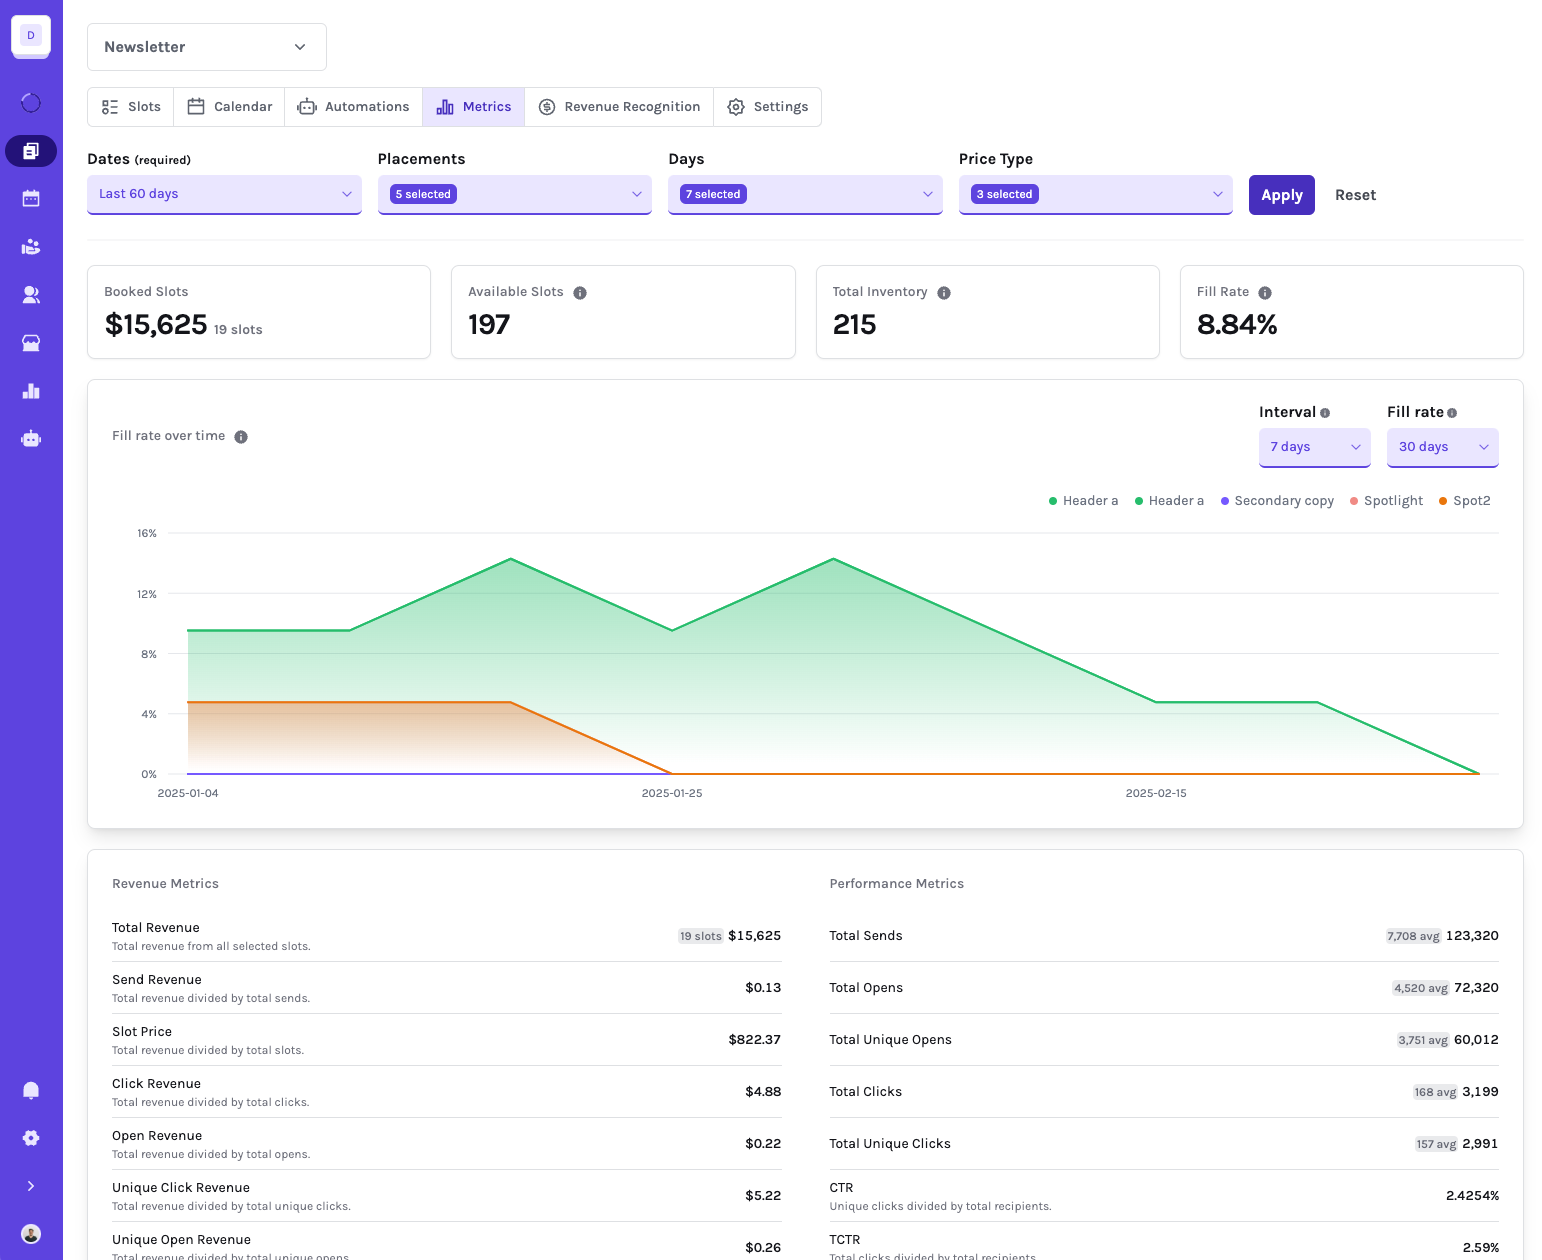
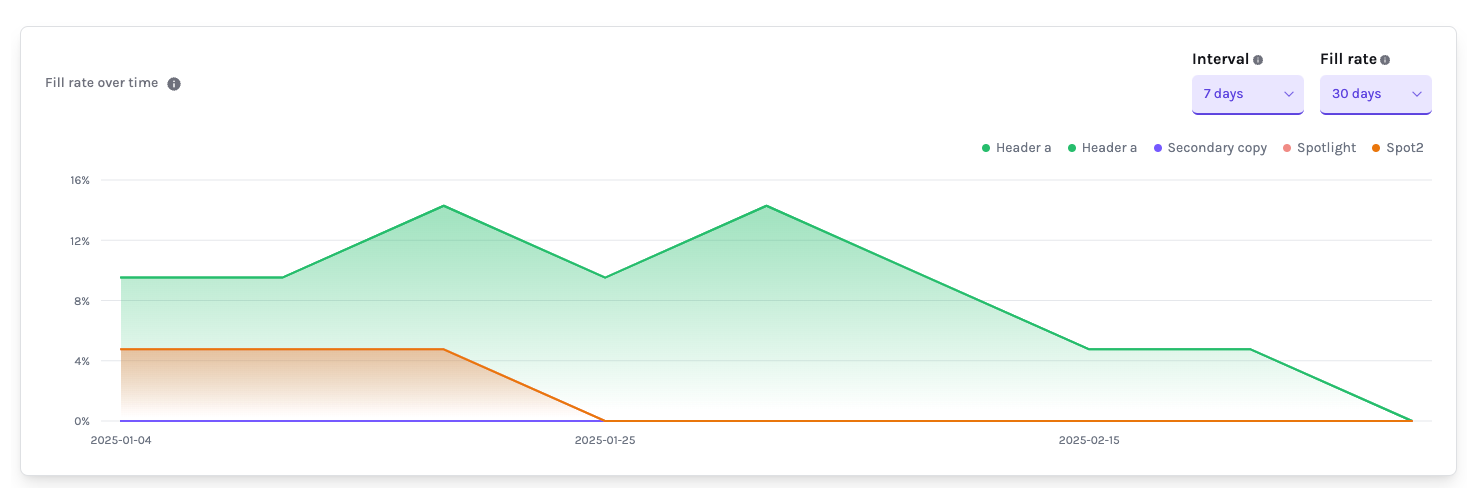
Fill rate over time
The Fill Rate Over Time graph displays the percentage of booked slots relative to the total available slots over a selected period. Adjust the interval to set the number of days between each data point, and define the fill rate period to specify the duration each data point represents.
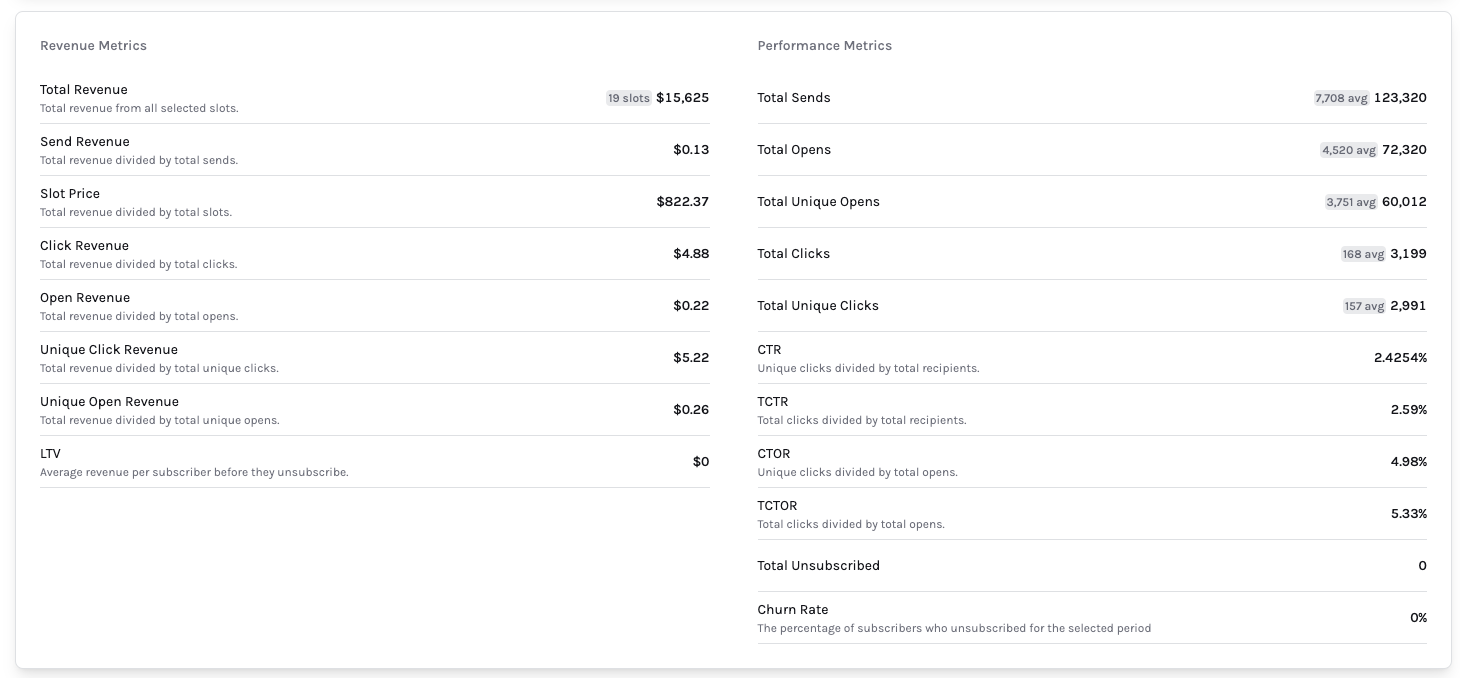
Revenue & Performance Overview
This section consolidates all collected and inputted metrics, such as pricing and performance data gathered through our ESP Integrations, providing a centralized view of your revenue and performance metrics.
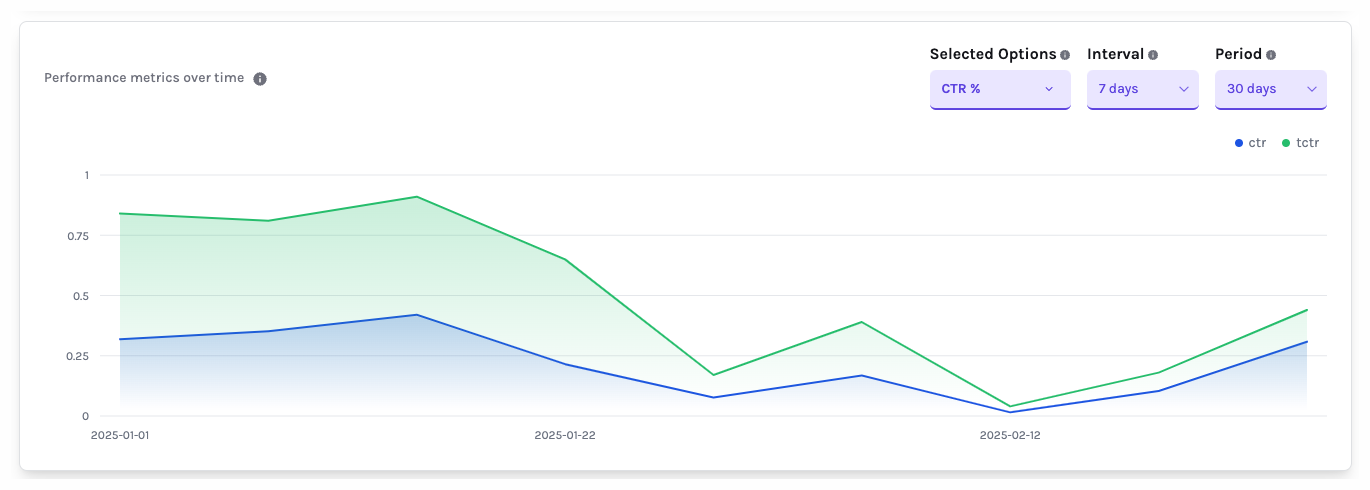
Performance Trends
Analyze the effectiveness of your sponsorships over time by selecting specific metrics to evaluate and compare, offering insights into trends and areas for improvement.
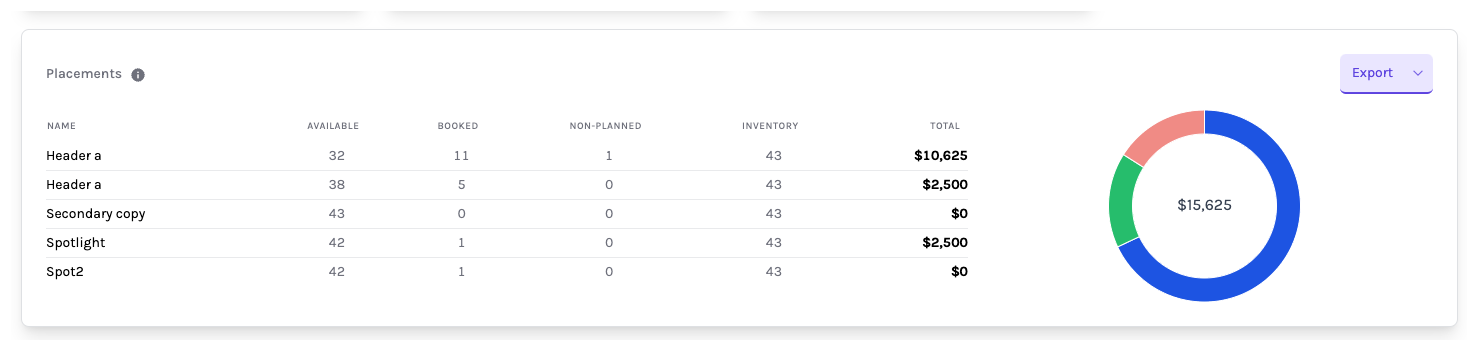
Placements Breakdown
View a detailed breakdown of booked slots across various placements, along with the total value per placement, helping you identify which placements are performing best.
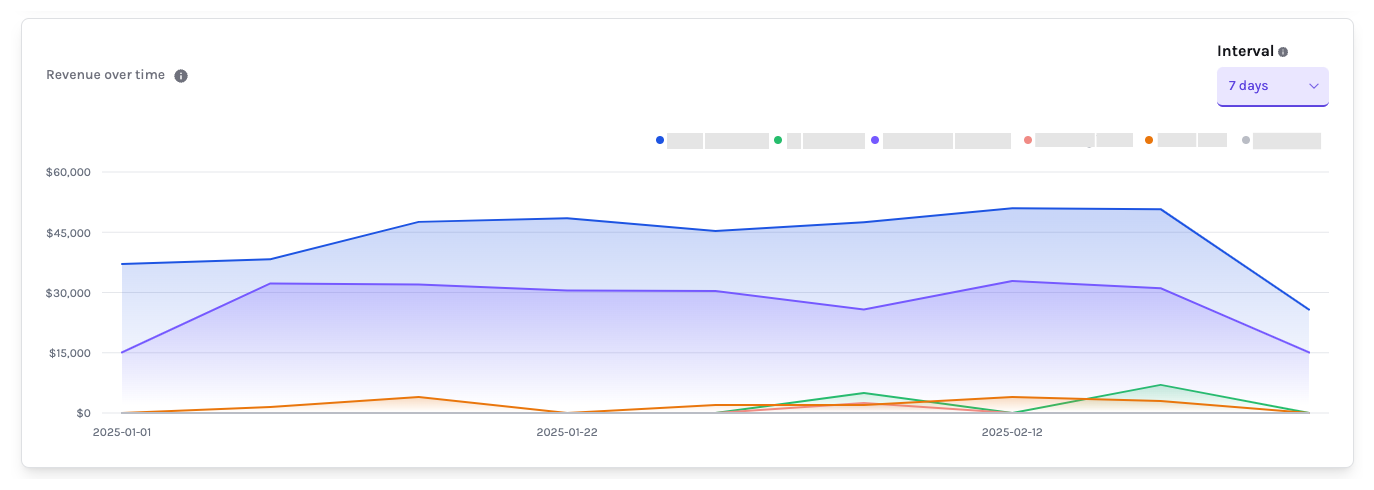
Revenue Trends
The Revenue Over Time graph illustrates your earnings across different placements over a selected period, offering a clear view of revenue trends and patterns.
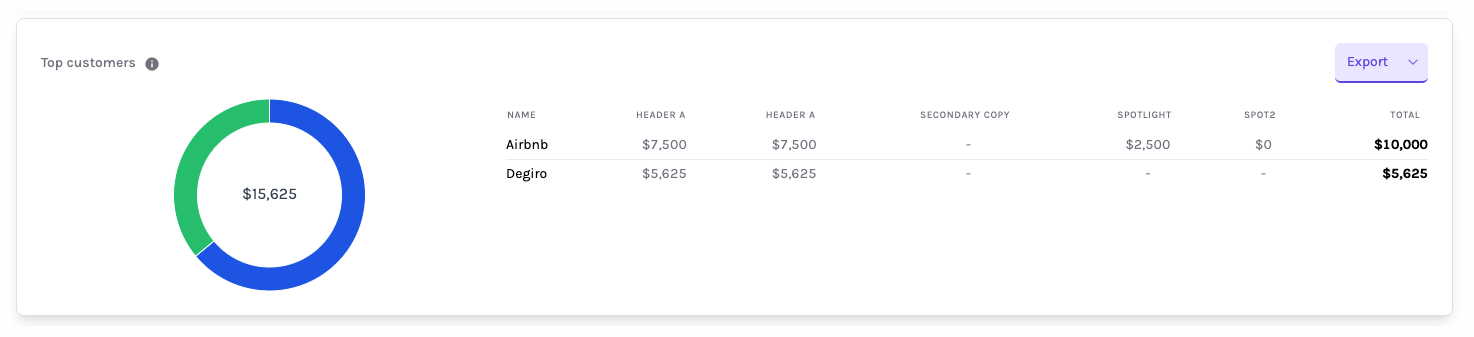
Top customers
Identify your most valuable customers with a breakdown of booked slots and total value by customer, enabling targeted strategies for retention and growth.
Revenue recognition
The Revenue Recognition page allows you to assess the performance of individual sponsorship placements, identify gaps, and detect missed earnings on a daily basis. By filling these gaps, you can increase your revenue and optimize your sponsorship strategy.
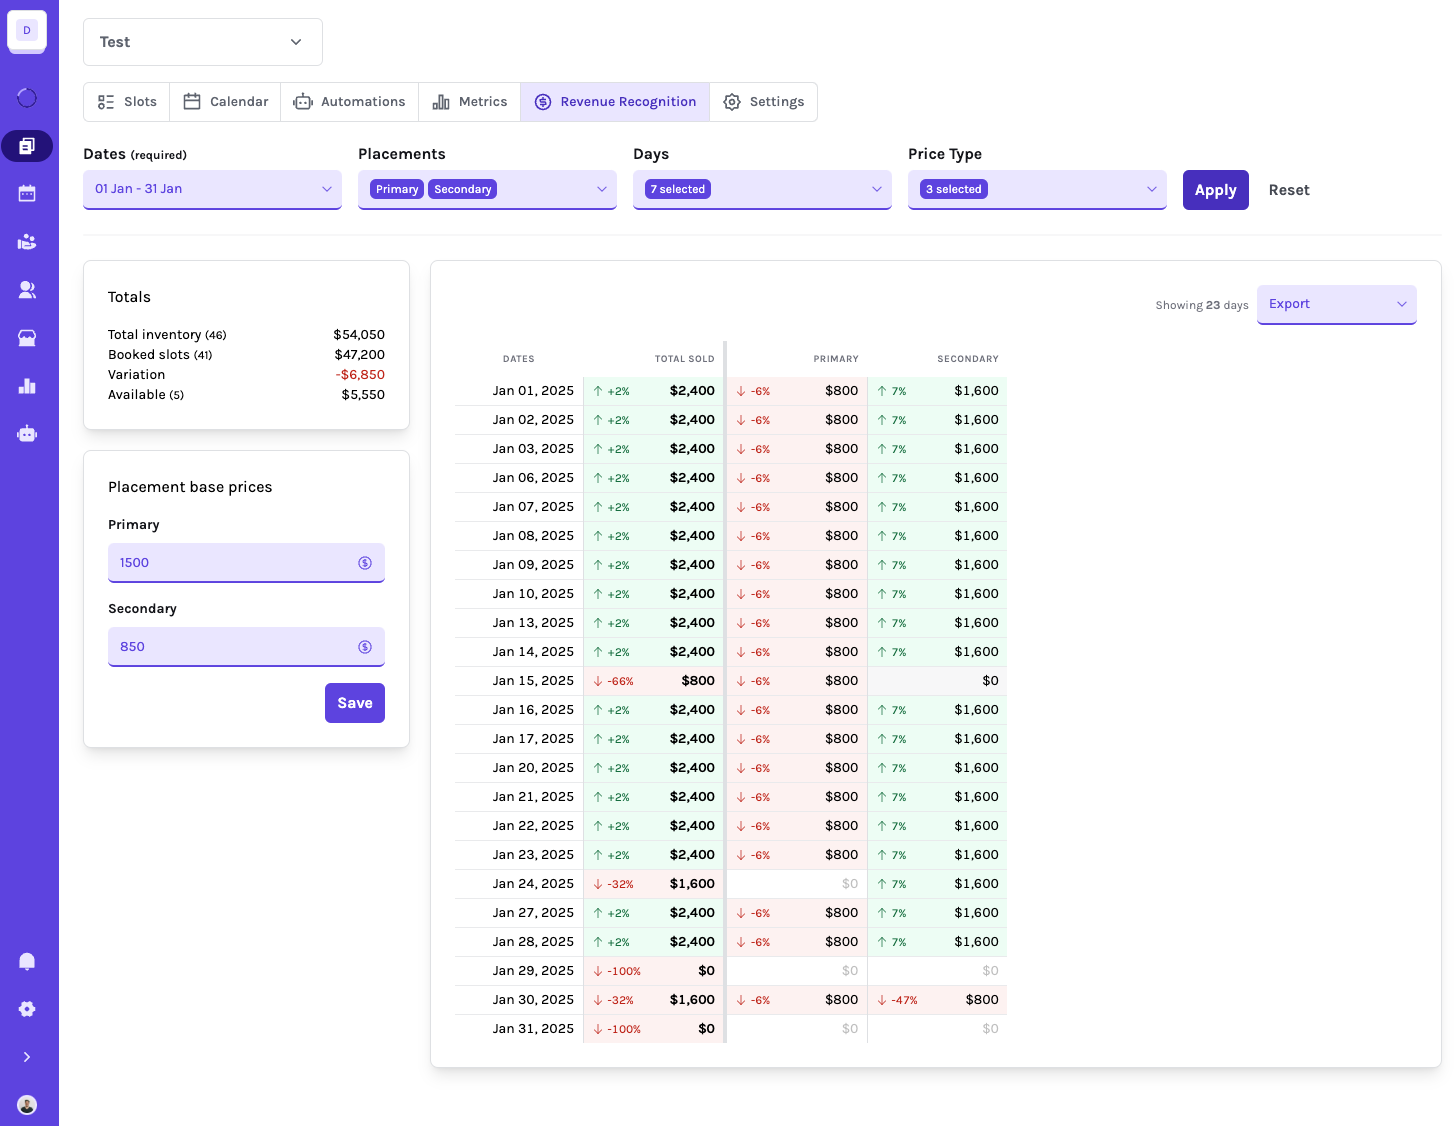
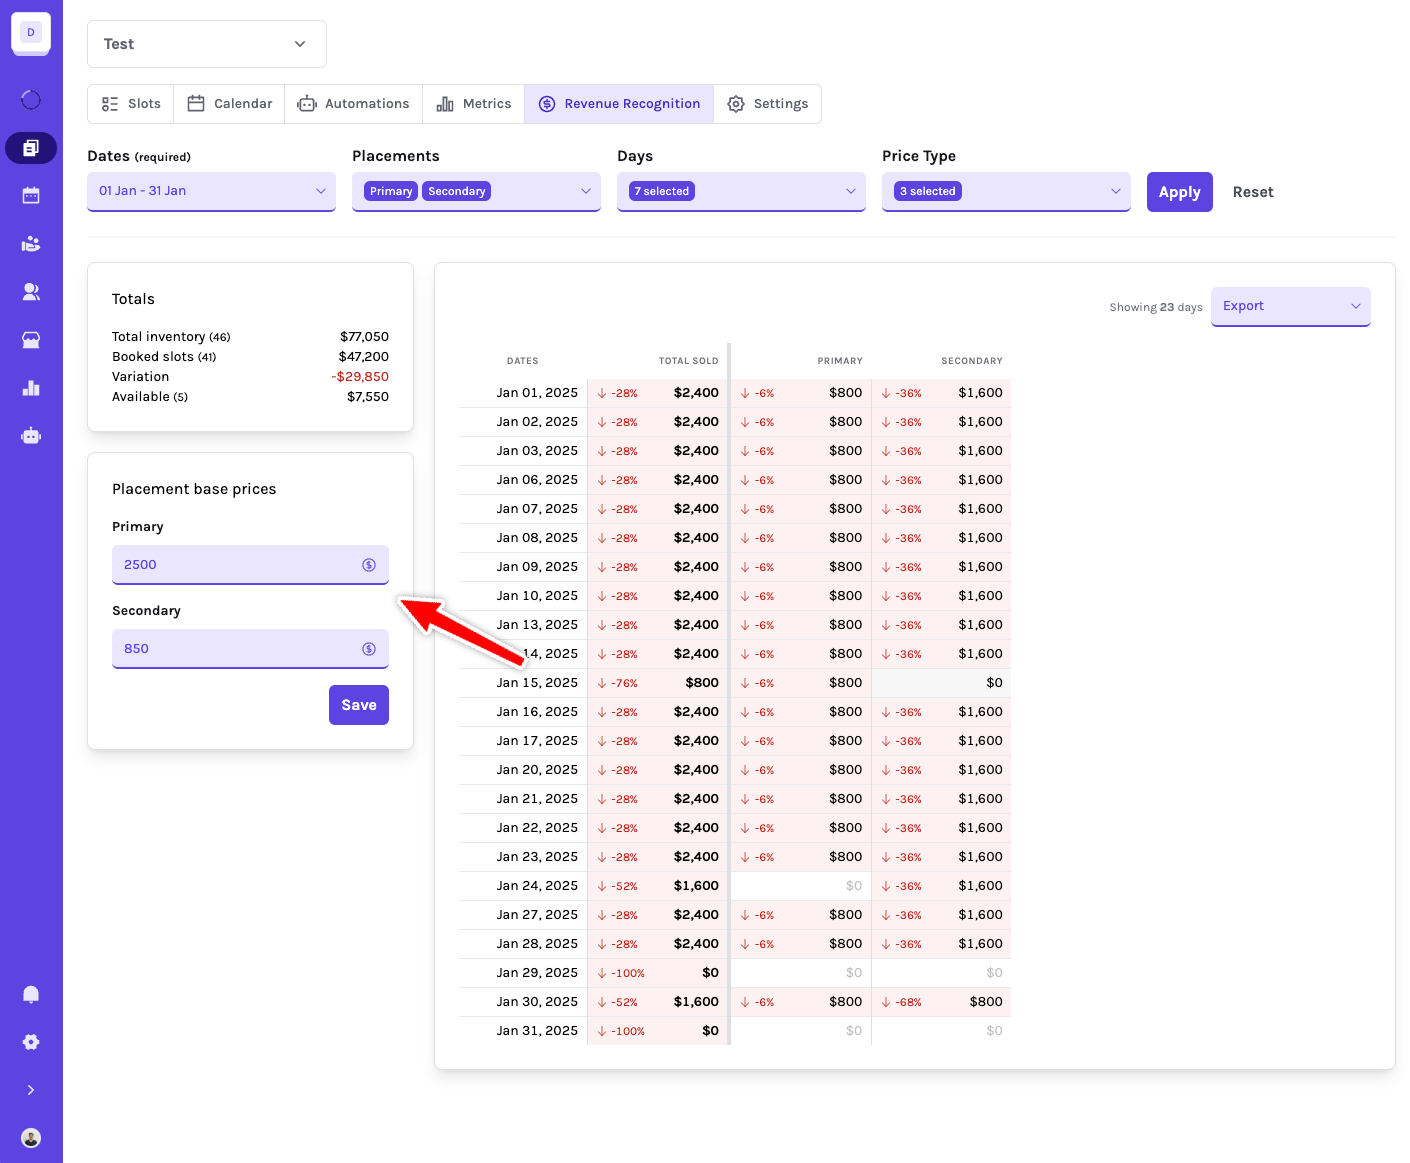
Simulating Base Prices
Utilize the Placement Base Prices tool to simulate and project how adjustments to your base prices influence bookings. Real-time projections help you understand the impact on your revenue, allowing for informed pricing decisions.
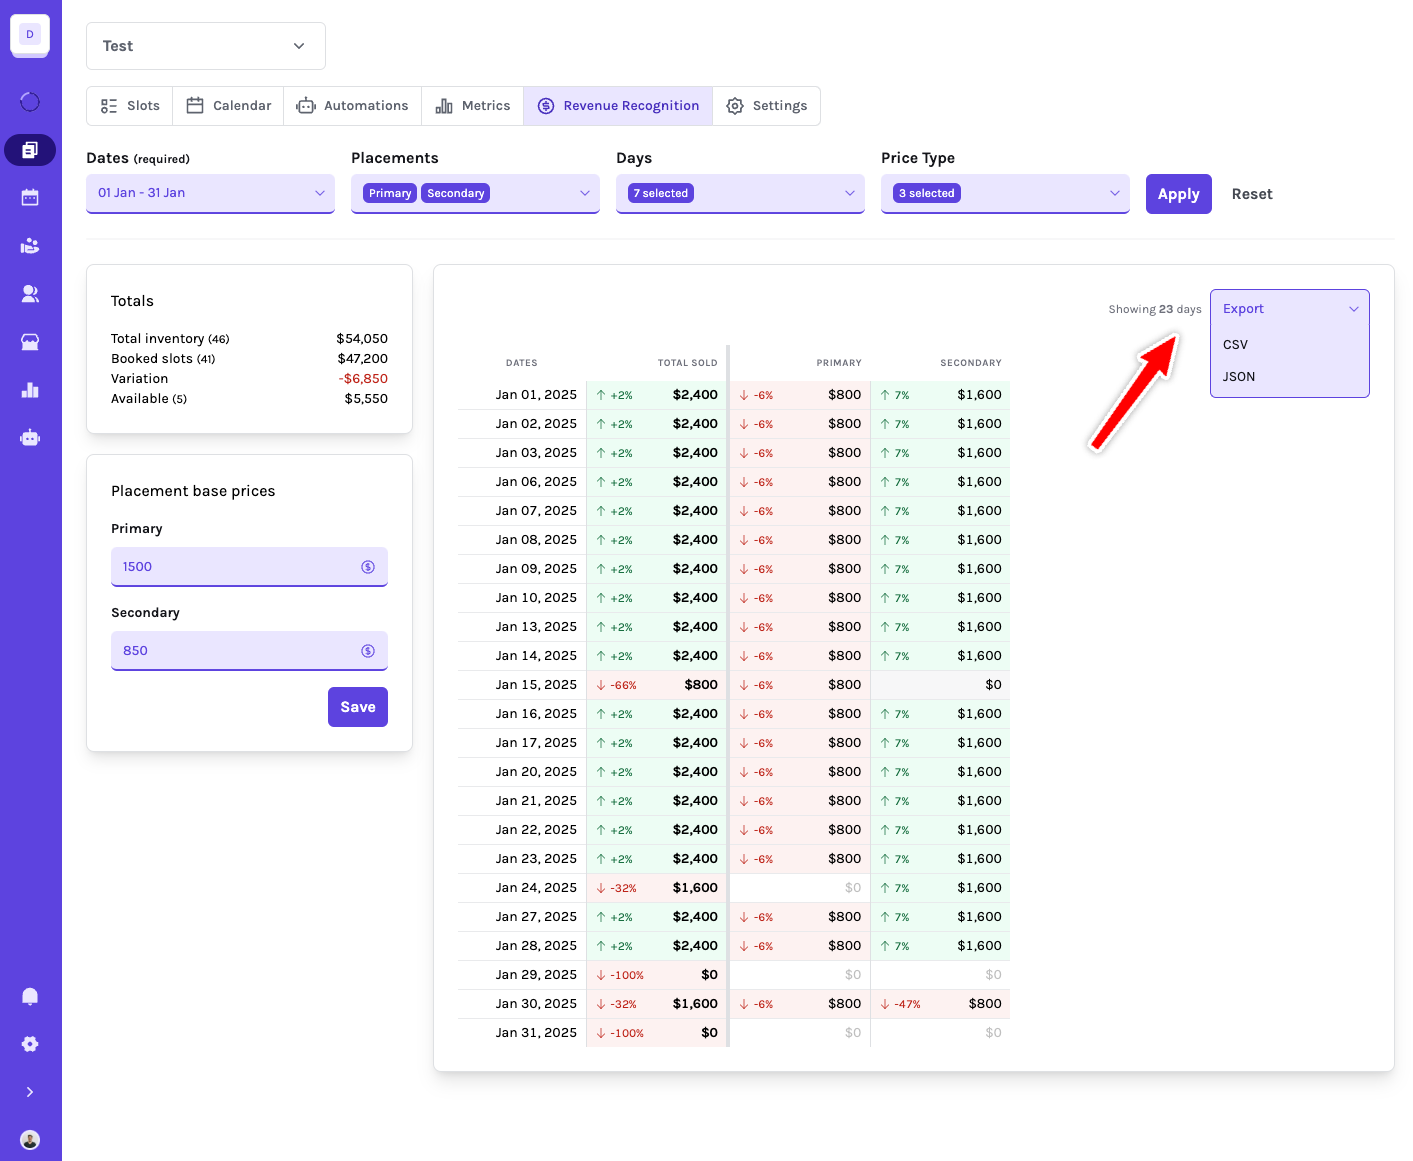
Exporting Revenue Reports
Easily export revenue reports by selecting your preferred format from the top right dropdown menu, facilitating seamless sharing and analysis of your revenue data.
By leveraging Sponsy’s Analytics & Reports module, you gain a comprehensive understanding of your sponsorship performance, empowering you to make data-driven decisions that enhance revenue and optimize your sponsorship strategies.