Metrics
The Metrics module gives you a workspace-wide view of sponsorship performance: revenue, fill rates, engagement, goals with notifications, publication comparisons, placement drilldowns, and daily revenue recognition.
The Metrics module is the analytics home for your whole workspace. It brings every publication together in one place so you can see how much you are earning, how full your inventory is, how sponsorships perform, and how you are pacing against your goals — then drill down from the workspace, to a publication, to an individual placement.
Metrics is available on every plan. Starter shows the last 30 days. Pro and Custom include full analytics history, flexible date ranges, comparisons, and exports.
Metrics has two tabs: Metrics for performance and goals, and Revenue Recognition for day-by-day earned revenue.
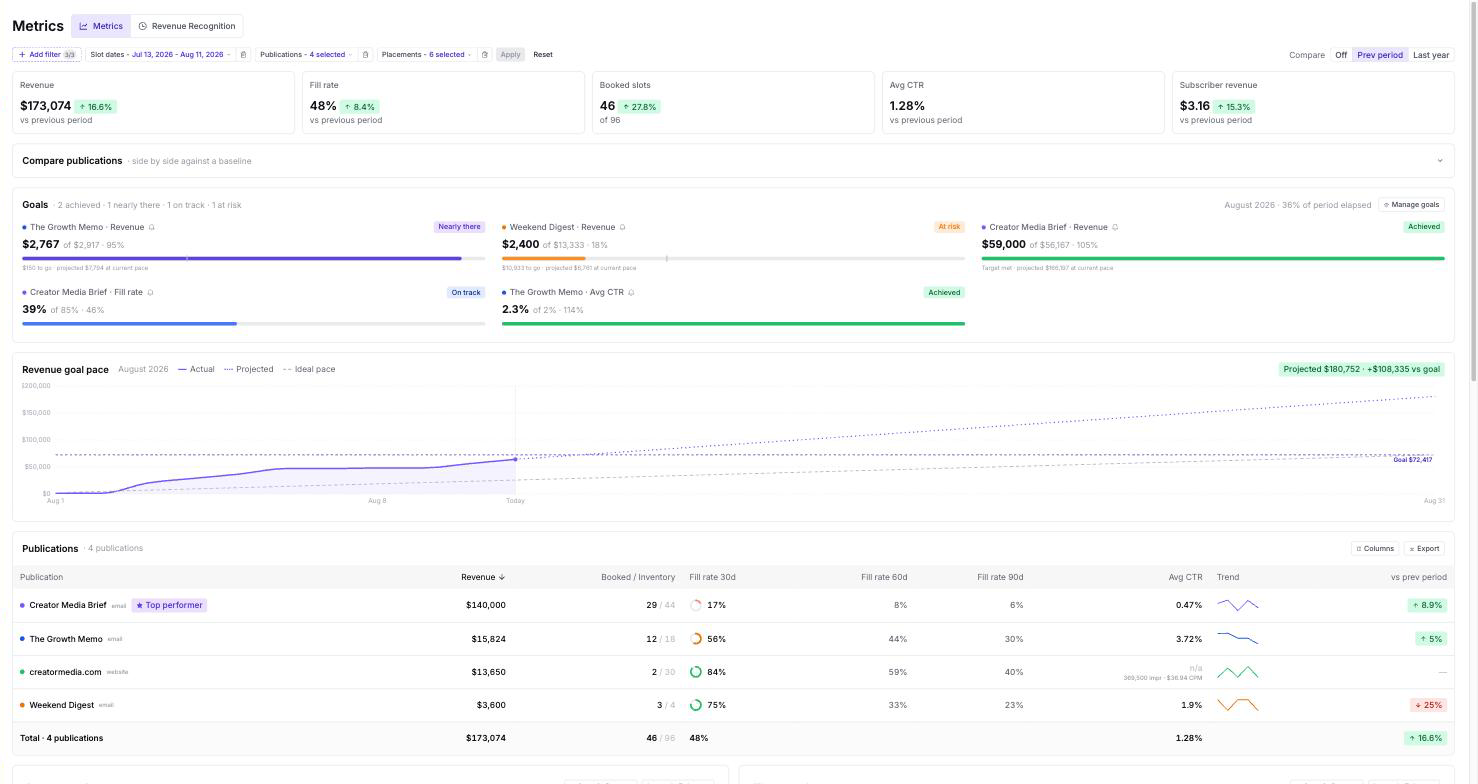
Metrics overview
The top of the page shows workspace-level KPIs for the selected period: Revenue, Fill rate, Booked slots, Average CTR, and Subscriber revenue. Each KPI shows how it changed versus the comparison period.
Filtering and comparing
Use the filter bar to focus the whole page:
- Slot dates — on Pro and Custom, choose fixed ranges or quick presets, including forward-looking ranges like "Next 30/60/90 days" for upcoming inventory. Starter uses Last 30 days.
- Publications and Placements — narrow the page to part of your portfolio.
- Compare — on Pro and Custom, switch between Previous period and Last year to control what the deltas compare against.
Every module on the page — KPIs, charts, tables, and top customers — respects the current filters.
Publications table
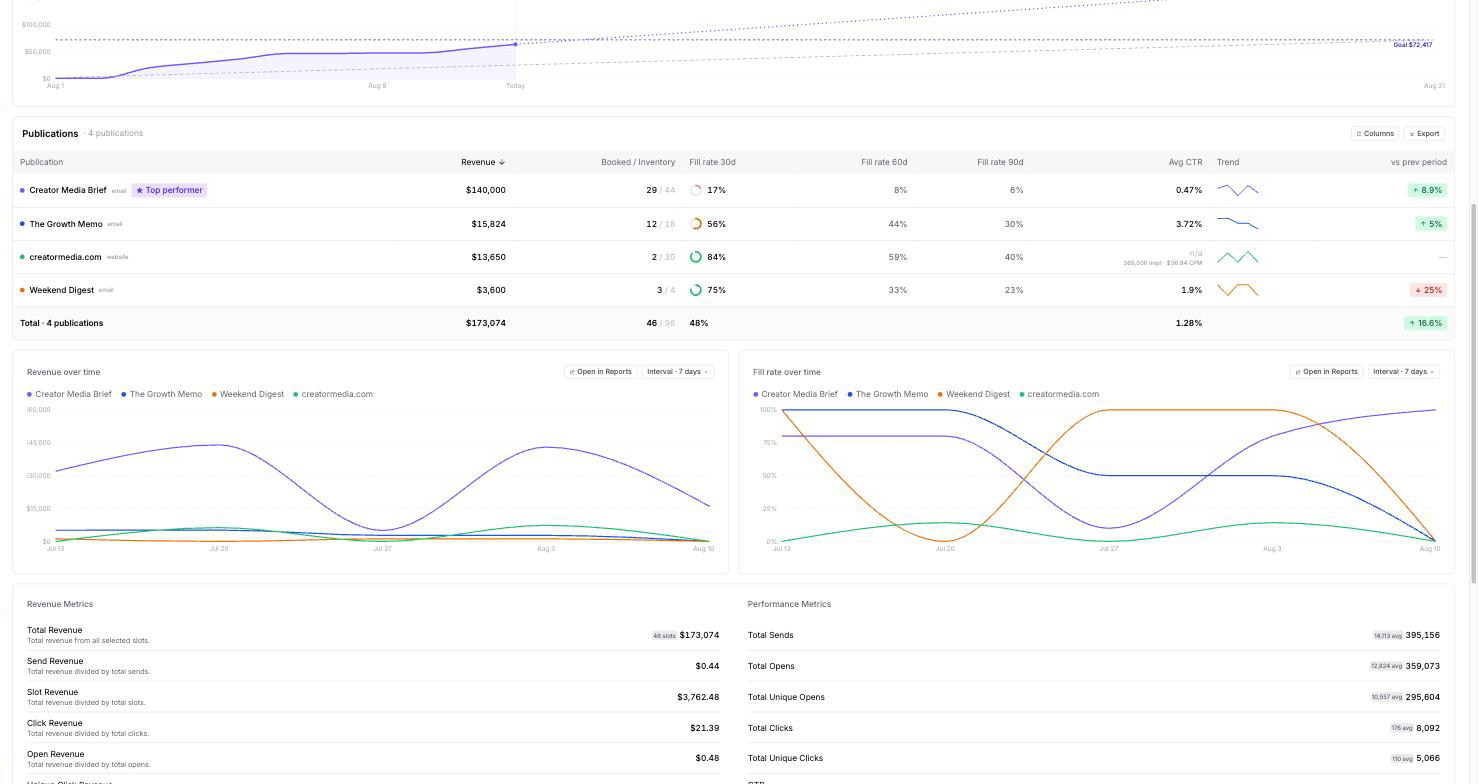
The Publications table shows one row per publication with revenue, booked slots against total inventory, fill rate for the next 30/60/90 days, average CTR, a revenue trend sparkline, and the change versus the comparison period. The best-earning publication is highlighted as Top performer.
Website publications appear alongside your newsletters with their own model: impressions and CPM replace email engagement, and inventory is computed from placements × days.
Use Columns to adjust the visible columns. On Pro and Custom, use Export to download the table as CSV.
Charts
Below the table, Revenue over time and Fill rate over time plot each publication as its own series. You can change the interval (for example 7-day buckets) and jump to the underlying data with Open in Reports.
Revenue and performance detail
The detail cards consolidate the same slots that power the KPIs, so the numbers always agree:
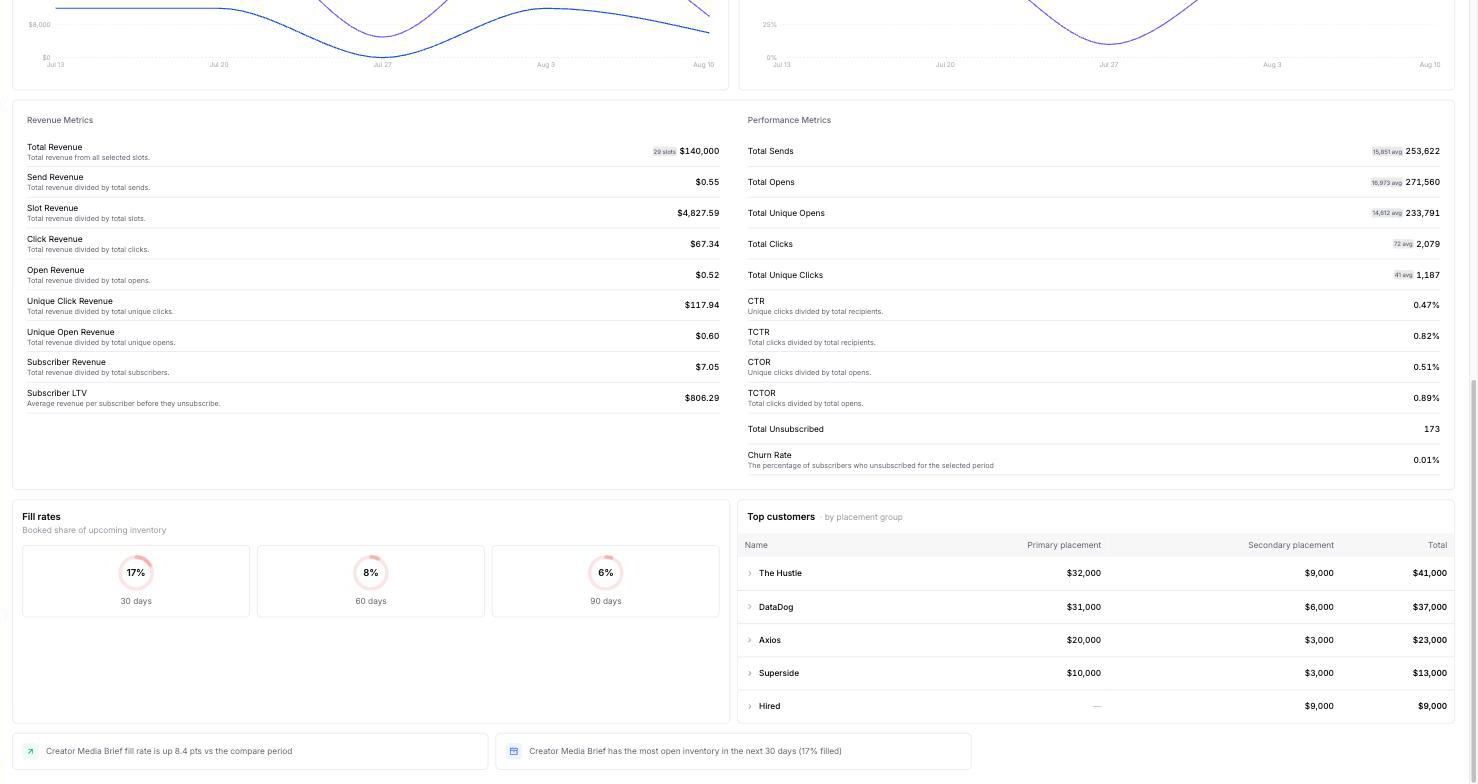
- Revenue Metrics — total revenue plus calculated revenue metrics (see below).
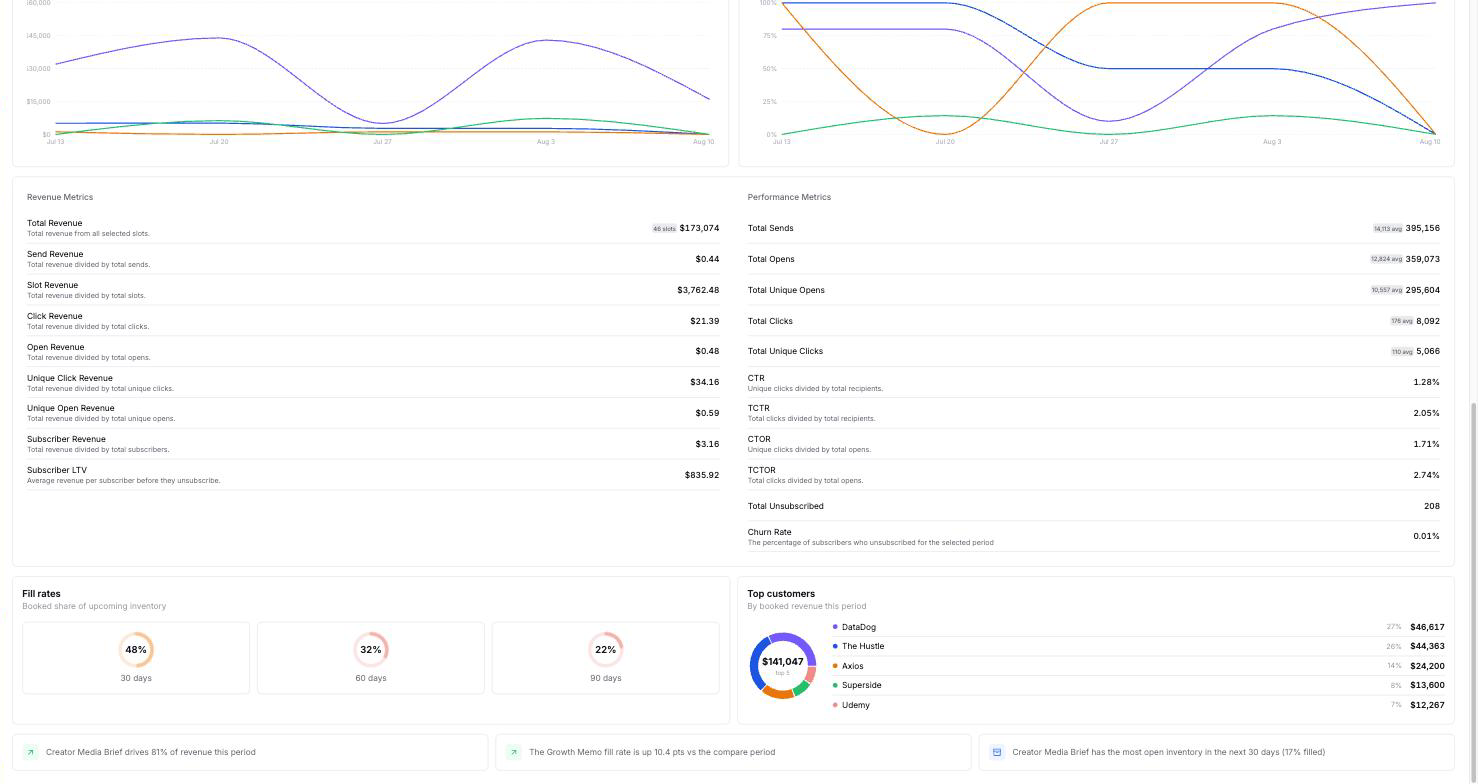
- Performance Metrics — sends, opens, unique opens, clicks, unique clicks, CTR, TCTR, CTOR, TCTOR, unsubscribes, and churn rate, collected through our ESP Integrations or entered manually.
Calculated revenue metrics
Sponsy combines the value of the booked slots in your selected view with their performance metrics.
Click Revenue answers: "How much booked revenue did each tracked click generate?"
Click Revenue = total slot revenue ÷ total clicks
For example, if the selected slots have a combined value of €1,000 and received 250 clicks, Click Revenue is €4.00.
The related revenue metrics use the same total slot revenue and change the performance metric used as the divisor:
- Unique Click Revenue: total slot revenue ÷ total unique clicks
- Send Revenue: total slot revenue ÷ total sends
- Open Revenue: total slot revenue ÷ total opens
- Unique Open Revenue: total slot revenue ÷ total unique opens
- Subscriber Revenue: total slot revenue ÷ total recipients
- Average Slot Price: total slot revenue ÷ the number of slots
- Subscriber LTV: average revenue per subscriber before they unsubscribe
Click Revenue is not the same as Unique Click Revenue or CPC. Click Revenue uses every tracked click, including repeat clicks. Unique Click Revenue counts each recipient once. CPC is a deal pricing or cost metric.
Revenue totals include non-deleted slots that are enabled for metrics and match the selected filters. If the divisor is zero or no performance data is available, Sponsy displays 0.
To audit a metric that looks unexpected:
- Check the selected date range and publication, placement, and customer filters.
- Confirm that the matching slots have the expected prices and are included in metrics.
- Check that click, open, and send data has been synchronized or entered for those slots.
- Compare Click Revenue with Unique Click Revenue to see whether repeat clicks explain the difference.
Fill rates and top customers
The Fill rates card shows the booked share of upcoming inventory for the next 30, 60, and 90 days. Top customers ranks your sponsors by booked revenue in the selected period, and insight strips at the bottom of the page call out notable movements — for example which publication drives most of your revenue, or where open inventory is concentrated.
Compare publications
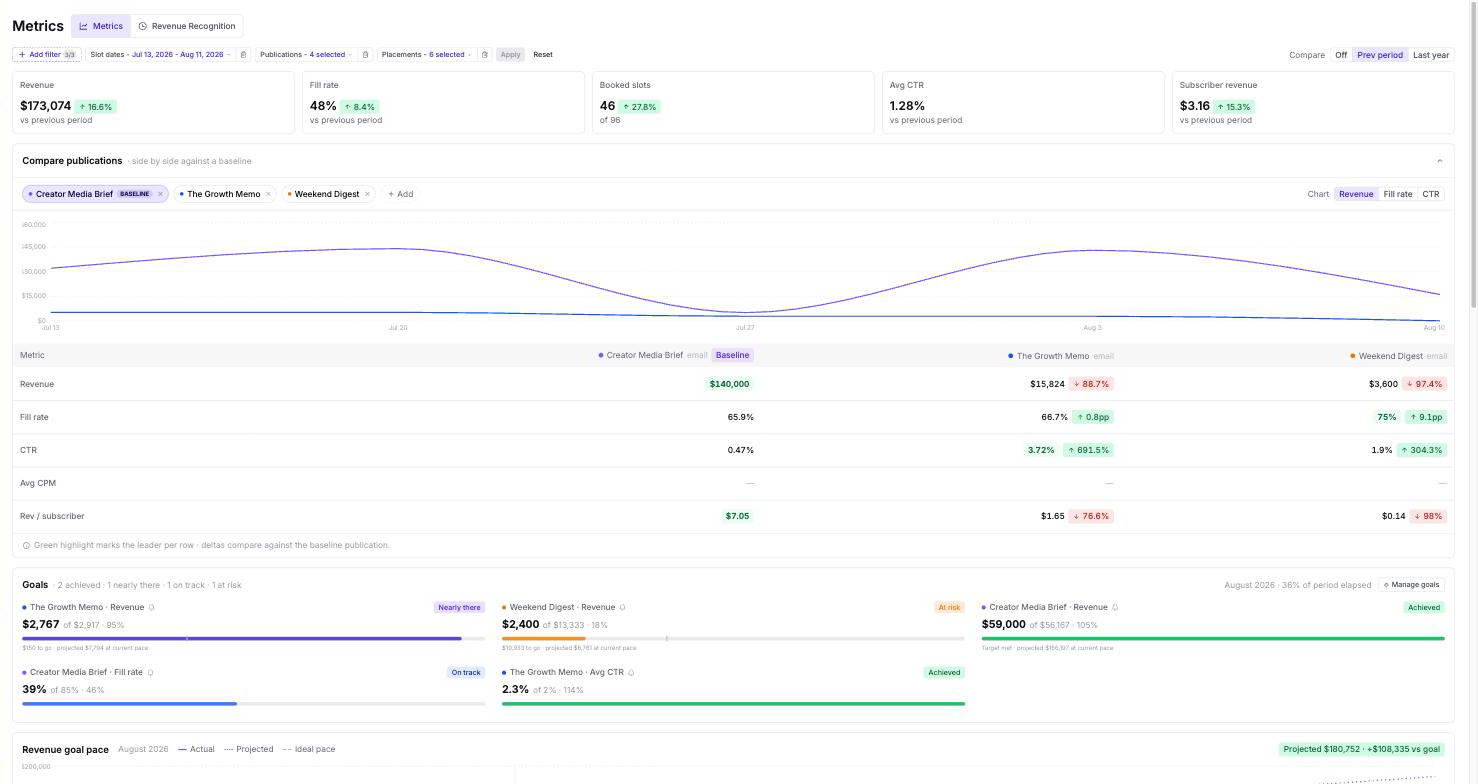
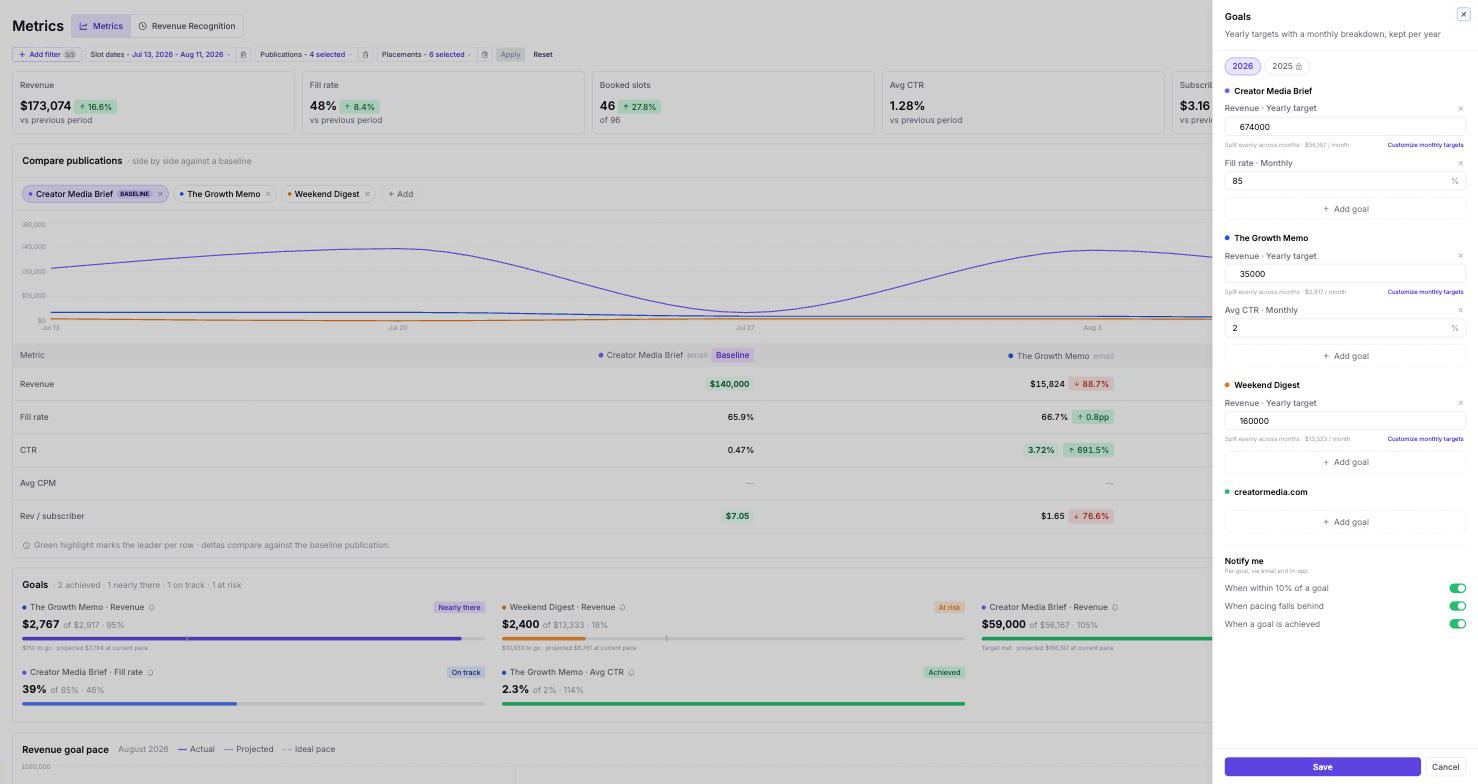
On Pro and Custom, open Compare publications to put two to four publications side by side against a baseline. Pick the metric to chart — Revenue, Fill rate, or CTR — and review the comparison table below it: the leader of each row is highlighted, and every other publication shows its delta against the baseline.
Goals
Set yearly targets per publication with Manage goals. Supported goal metrics:
- Revenue — a yearly target, split evenly across months by default. Use Customize monthly targets when your business is seasonal.
- Fill rate and Average CTR — monthly targets.
- Impressions — monthly targets for website publications.
Goals are kept per year, so you can review past years and plan the next one. Managing goals — the targets and the team-wide notification settings — requires permission to edit financial data, regardless of goal type; the Manage goals button only appears for members who have it.
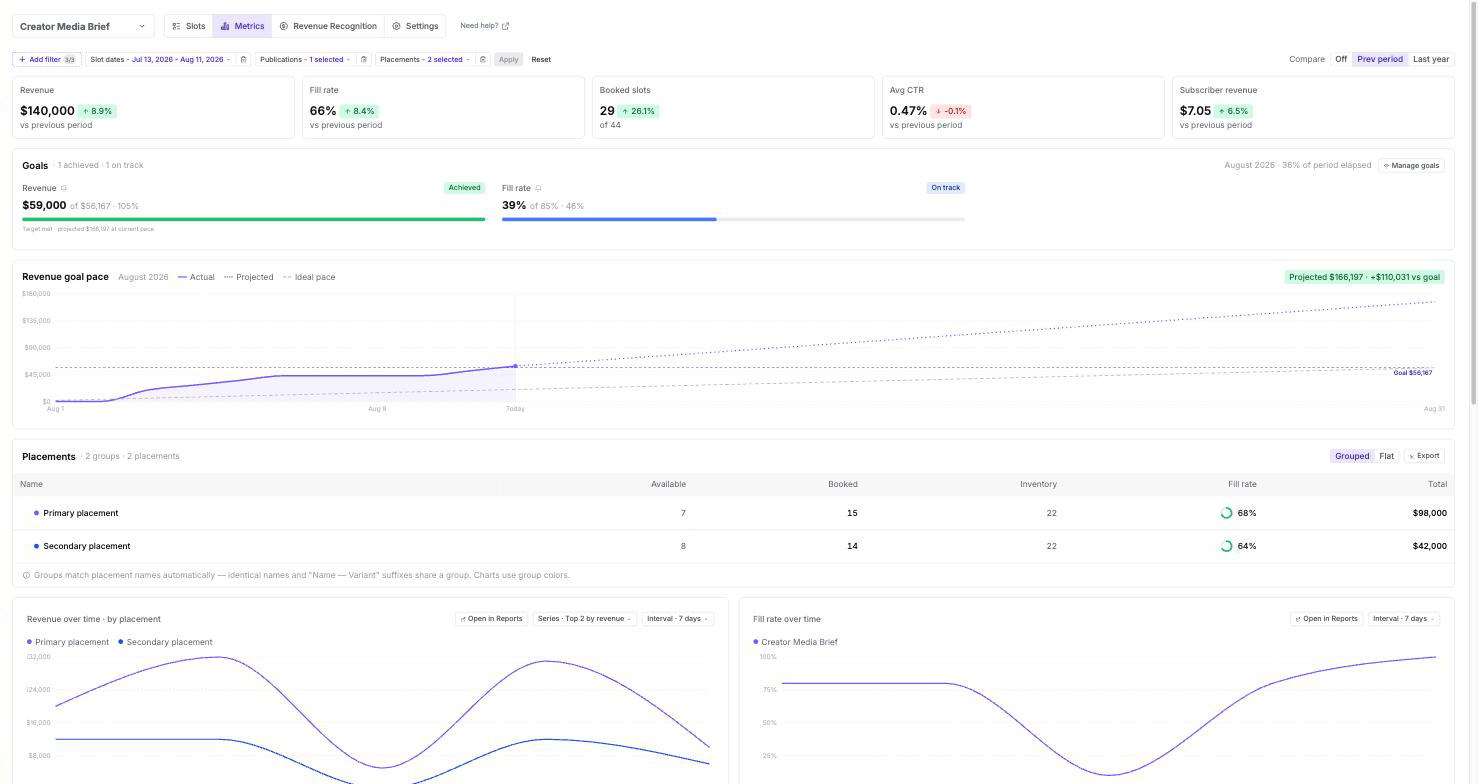
The Goals section on the Metrics page shows each goal's current value, progress, and status — Achieved, Nearly there, On track, or At risk — based on how the month is pacing. The Revenue goal pace chart plots actual revenue against the ideal pace for the month and projects where you will land at the current rate.
Goal notifications
Under Notify the team in the goals drawer you can choose which changes Sponsy announces to the workspace, per goal, via email and in-app notification:
- When within 10% of a goal — a goal becomes Nearly there.
- When pacing falls behind — a goal becomes At risk.
- When a goal is achieved — a goal reaches its target.
Sponsy checks goals daily and notifies only when a goal's status changes, so you are not re-notified every day while a goal stays in the same state. When several goals change status on the same day, they arrive together as a single email.
Notifications respect workspace permissions: they only go to members with analytics access, revenue goal alerts are only sent to members who can see financial data, and members scoped to specific publications only receive alerts for those publications.
Your personal notification preferences
Workspace goal notifications are on for everyone by default, but each member controls their own under Settings → Notifications → Goal updates:
- Turn Goal updates off to stop receiving goal emails and in-app alerts entirely — without affecting anyone else in the workspace.
- Pick an email cadence: Instant sends a same-day email when goals change status; Weekly digest collects the week's changes into one Monday email. If a goal changes status more than once during the week, the digest keeps only the latest update.
In-app notifications are always instant, regardless of the email cadence.
Publication drilldown
Open a publication's Metrics tab (from the Inventory Hub) to see the same analytics scoped to that publication, plus placement-level detail:
- Placements table — available, booked, inventory, fill rate, and revenue per placement. Placements with the same name — or "Name — Variant" suffixes — are grouped automatically; switch to Flat to see each placement separately.
- Revenue over time · by placement — chart the top placements by revenue, or hand-pick the series you want to compare.
- Top customers · by placement group — a matrix of your customers against placement groups, showing who books what.
Revenue Recognition
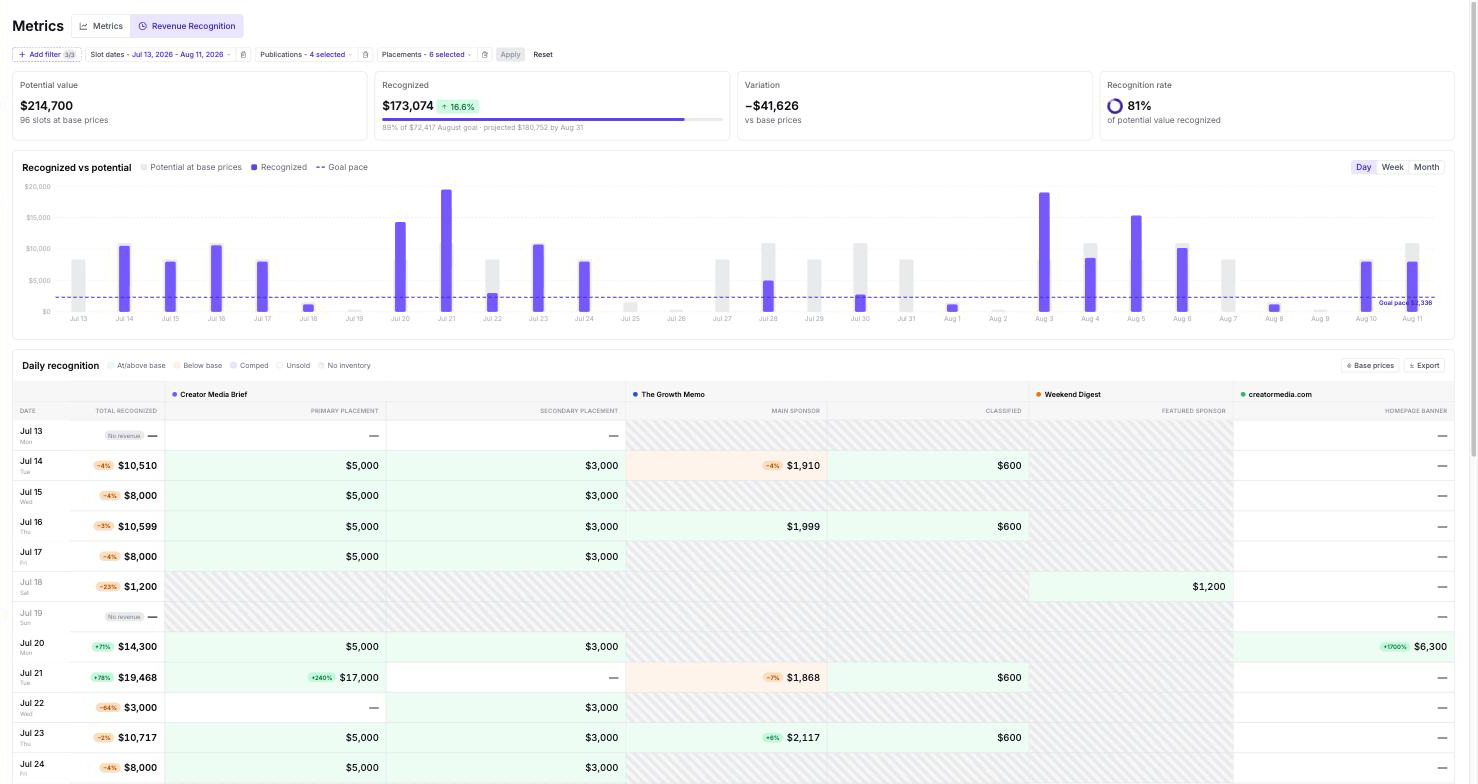
The Revenue Recognition tab tracks earned revenue day by day so you can spot gaps and missed earnings:
- KPIs — potential value at base prices, recognized revenue with progress against your monthly revenue goal, variation versus base prices, and the recognition rate.
- Recognized vs potential — a daily, weekly, or monthly chart of recognized revenue against potential, with a goal-pace line.
- Daily recognition — one row per day and one column per placement, color-coded: at/above base price, below base, comped, unsold, or no inventory. Blocked dates are hatched so gaps you planned are not counted against you.
A comped slot is booked at no charge. It occupies inventory and appears as booked in the table, but contributes $0 to recognized revenue.
Use Base prices to review and simulate placement base prices, and Export to download the revenue data.
Looking for report building, saved reports, and CSV/JSON exports? Those live in Reports.